Candela
X Model
X Model
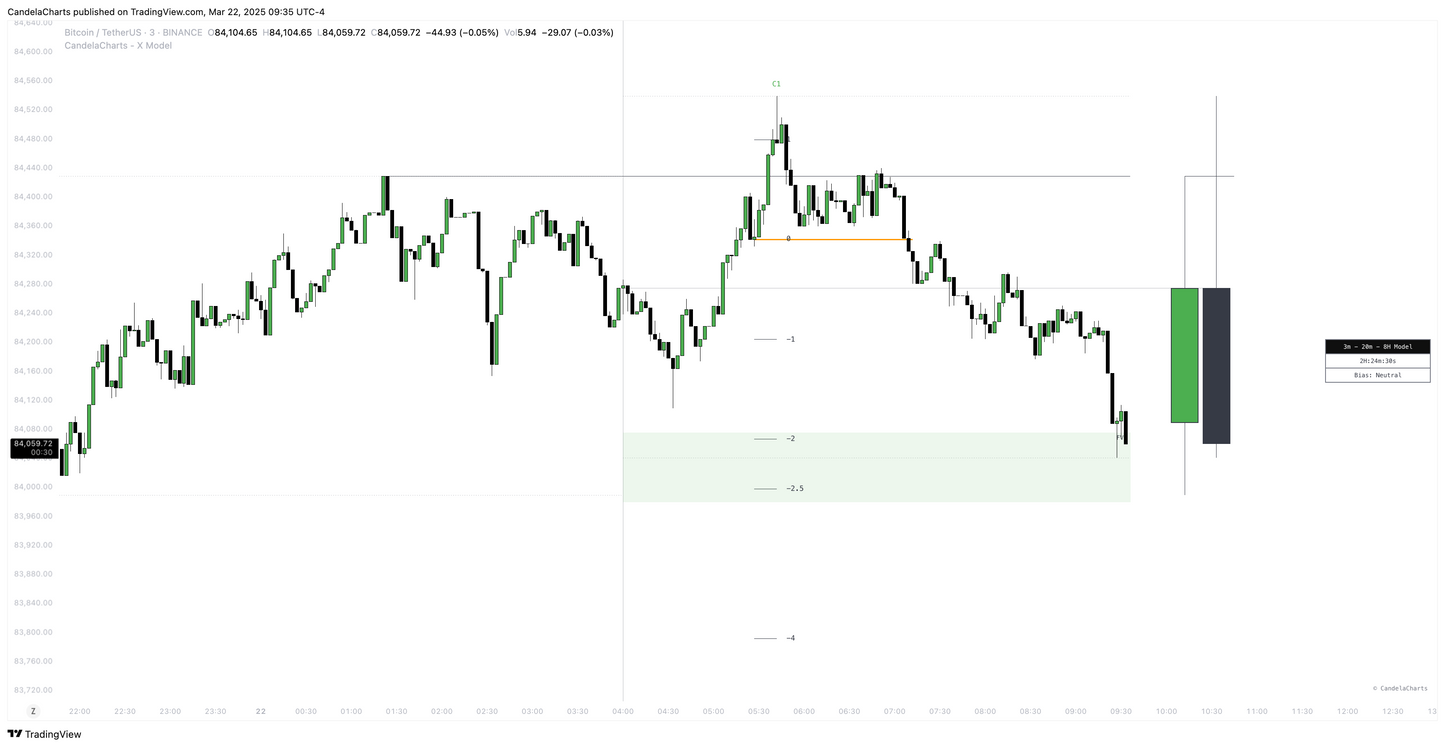
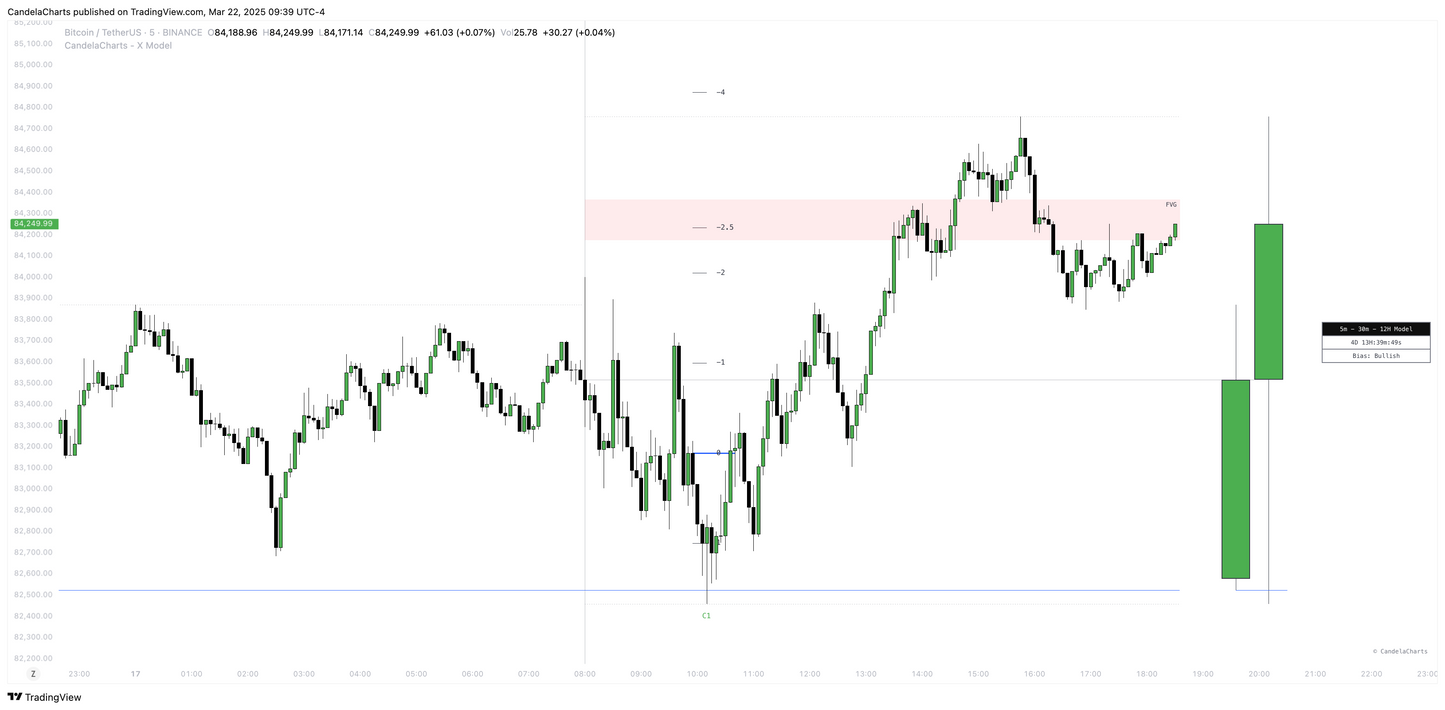
The CandelaCharts X Model is a powerful multi-timeframe trading strategy built for traders who seek high-precision entries and institutional-level insights.
Designed for use on TradingView, this advanced model combines price action logic, key liquidity levels, and smart money concepts to generate strategic buy and sell signals across any market - forex, crypto, stocks, indices, and futures.
Key Features:
- Previous Day High/Low (ERL): Maps essential support and resistance from the previous session to identify reaction zones.
- H1 Fair Value Gaps (IRL): Highlights bullish or bearish FVGs (Fair Value Gaps) on the 1-hour chart for anticipating price targets.
- m15 MSS & SMT Confluence: Uses Market Structure Shifts and Smart Money Technique on the 15-minute chart to validate directional bias.
- Timed Entry Filters (00:00 Reset): Trades are triggered only after midnight to avoid noise and improve entry timing.
Multi-Timeframe Framework:
The X Model supports a range of triple-timeframe combinations, including:
- 1m-5m-1H, 15m-1H-1D, 4H-1D-1M, 1D-1W-3M, and more. This allows traders to align short-term signals with long-term trends for superior trade confirmation.
Optimized for:
- Scalping and day trading
- Swing and positional trading
- Market structure traders
- Smart money & ICT-based strategies
- Traders looking for confluence across timeframes
Whether you're trading volatile crypto pairs or blue-chip stocks, the CandelaCharts X Model gives you a structured, rules-based approach for navigating market setups with clarity and confidence.
Share


Blog
View all-

Understanding SFP In Trading
Candela Charts1. What is a Swing Failure Pattern (SFP)? A Swing Failure Pattern (SFP) occurs when the price temporarily breaks a key swing high or low but fails to continue in that direction,...
Understanding SFP In Trading
Candela Charts1. What is a Swing Failure Pattern (SFP)? A Swing Failure Pattern (SFP) occurs when the price temporarily breaks a key swing high or low but fails to continue in that direction,...
-

Trading Strategy: ICT Venom Model
Candela ChartsThe ICT Venom Model is an intraday trading strategy that leverages liquidity sweeps, Fair Value Gaps (FVGs), and Market Structure Shifts (MSS) to identify precise trade entries.
Trading Strategy: ICT Venom Model
Candela ChartsThe ICT Venom Model is an intraday trading strategy that leverages liquidity sweeps, Fair Value Gaps (FVGs), and Market Structure Shifts (MSS) to identify precise trade entries.
-

Understanding VWAP In Trading
Candela ChartsVWAP is a price benchmark that gives more importance to prices where higher trading volume occurs. Unlike simple moving averages, which treat each price point equally, VWAP provides a volume-weighted...
Understanding VWAP In Trading
Candela ChartsVWAP is a price benchmark that gives more importance to prices where higher trading volume occurs. Unlike simple moving averages, which treat each price point equally, VWAP provides a volume-weighted...
Subscribe to our emails
Be the first to know about new tools and exclusive offers.


