Candela
RSI - Course
RSI - Course
Couldn't load pickup availability
Once you complete the checkout process, you'll receive a link on your email to download the course — no payment method required.
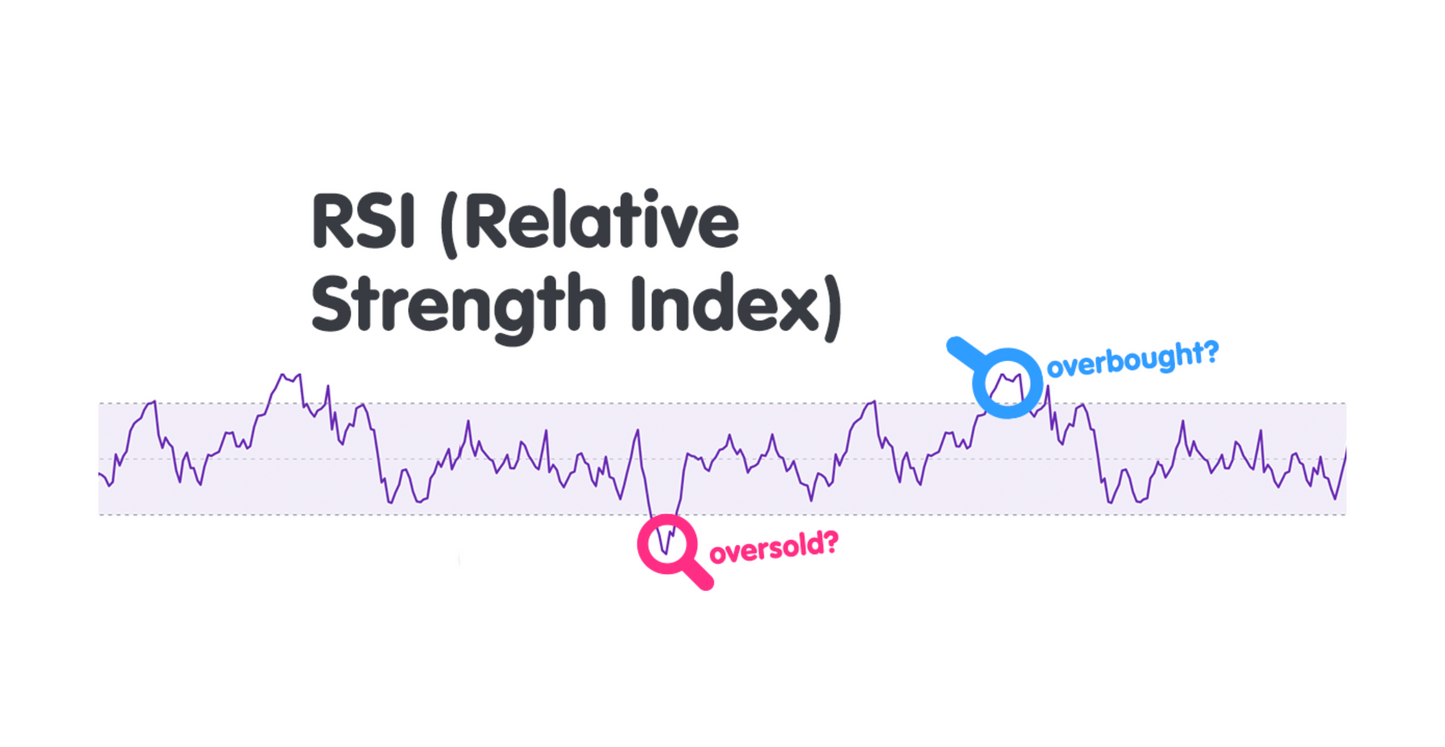
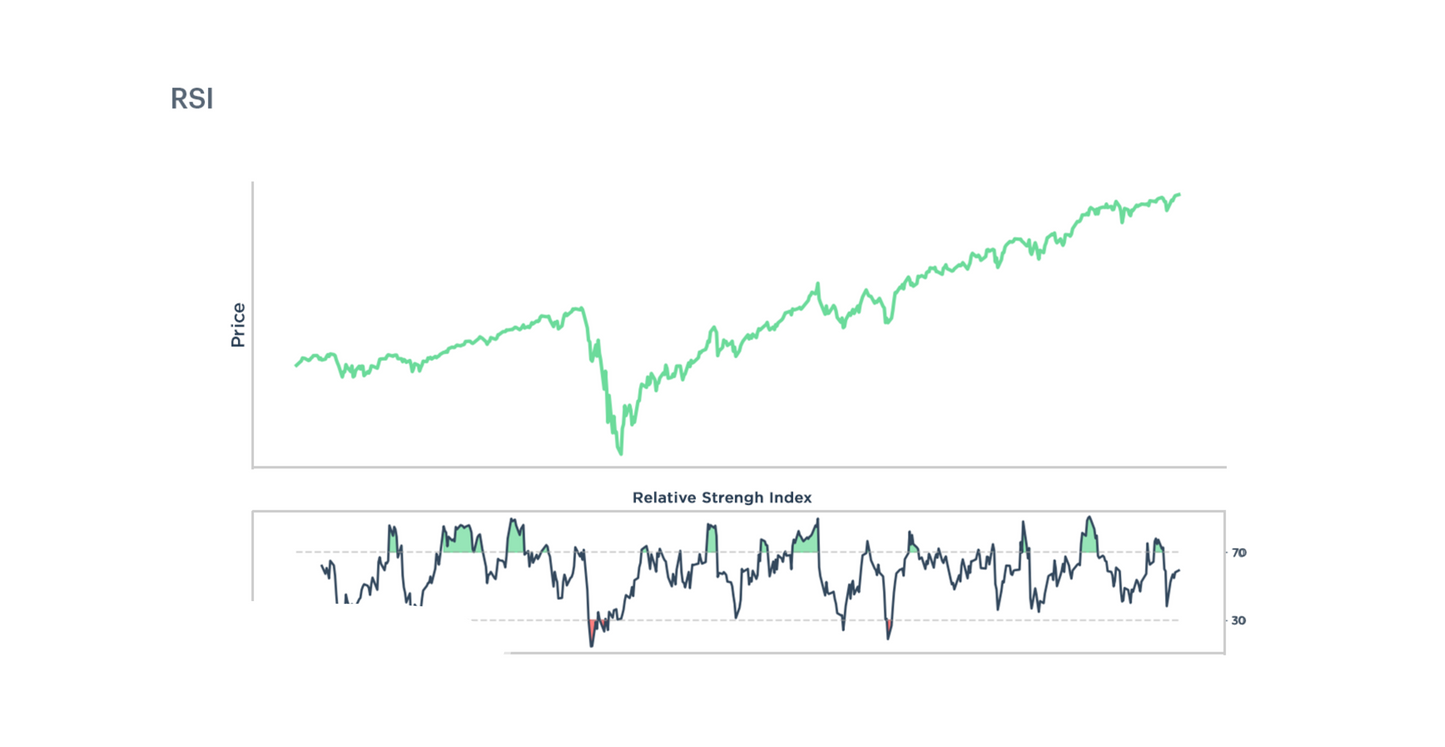
Unlock the power of the Relative Strength Index (RSI) with this comprehensive course. Learn how to use the RSI indicator to identify overbought and oversold conditions, spot market trends, and improve your trading decisions.
Whether you're new to technical analysis or looking to refine your strategies, this course covers everything you need to know about RSI.
Key topics:
- RSI basics and calculation
- How to spot overbought and oversold levels
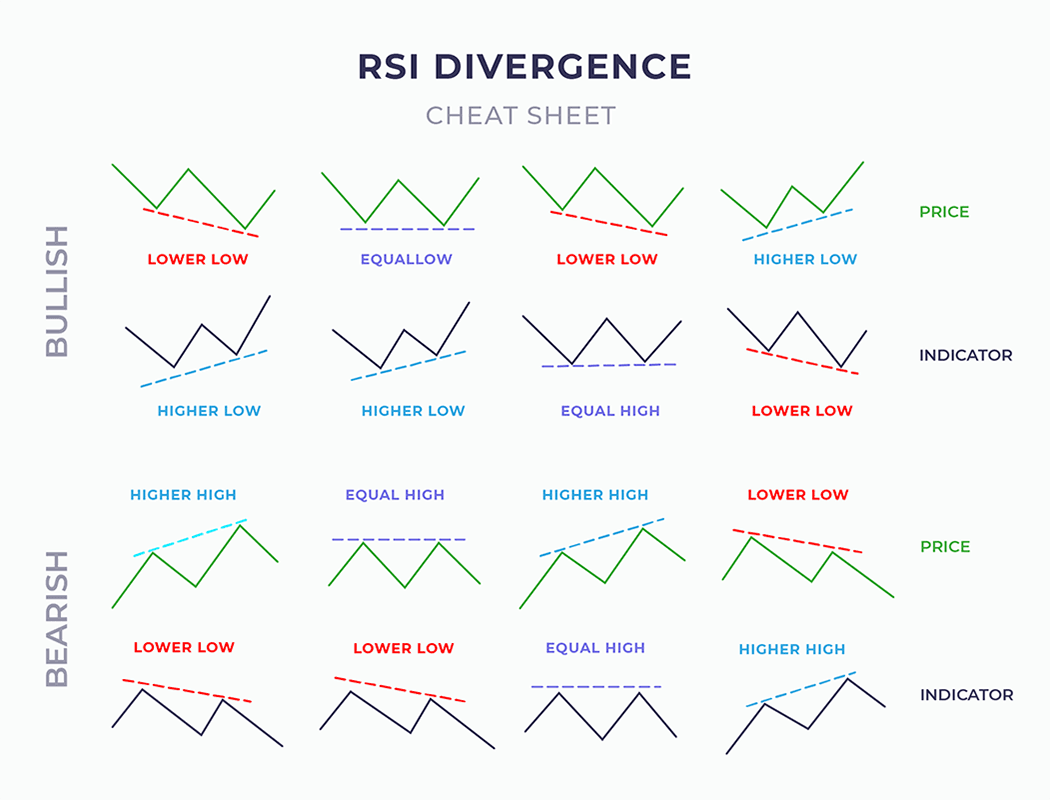
- Identifying trend reversals and price divergence
- Advanced RSI strategies for better market predictions
By the end of this course, you'll be ready to confidently use RSI for more accurate trades in stocks, forex, and cryptocurrencies. Start mastering RSI today!
Share


Blog
View all-

Understanding SFP In Trading
Candela Charts1. What is a Swing Failure Pattern (SFP)? A Swing Failure Pattern (SFP) occurs when the price temporarily breaks a key swing high or low but fails to continue in that direction,...
Understanding SFP In Trading
Candela Charts1. What is a Swing Failure Pattern (SFP)? A Swing Failure Pattern (SFP) occurs when the price temporarily breaks a key swing high or low but fails to continue in that direction,...
-

Trading Strategy: ICT Venom Model
Candela ChartsThe ICT Venom Model is an intraday trading strategy that leverages liquidity sweeps, Fair Value Gaps (FVGs), and Market Structure Shifts (MSS) to identify precise trade entries.
Trading Strategy: ICT Venom Model
Candela ChartsThe ICT Venom Model is an intraday trading strategy that leverages liquidity sweeps, Fair Value Gaps (FVGs), and Market Structure Shifts (MSS) to identify precise trade entries.
-

Understanding VWAP In Trading
Candela ChartsVWAP is a price benchmark that gives more importance to prices where higher trading volume occurs. Unlike simple moving averages, which treat each price point equally, VWAP provides a volume-weighted...
Understanding VWAP In Trading
Candela ChartsVWAP is a price benchmark that gives more importance to prices where higher trading volume occurs. Unlike simple moving averages, which treat each price point equally, VWAP provides a volume-weighted...
Subscribe to our emails
Be the first to know about new tools and exclusive offers.


