Candela
PAT Plan
PAT Plan
All future indicators designed for the PAT Plan will be automatically added to your account according to your subscription option as soon as they are released.
The Price Action Toolkit Plan includes:
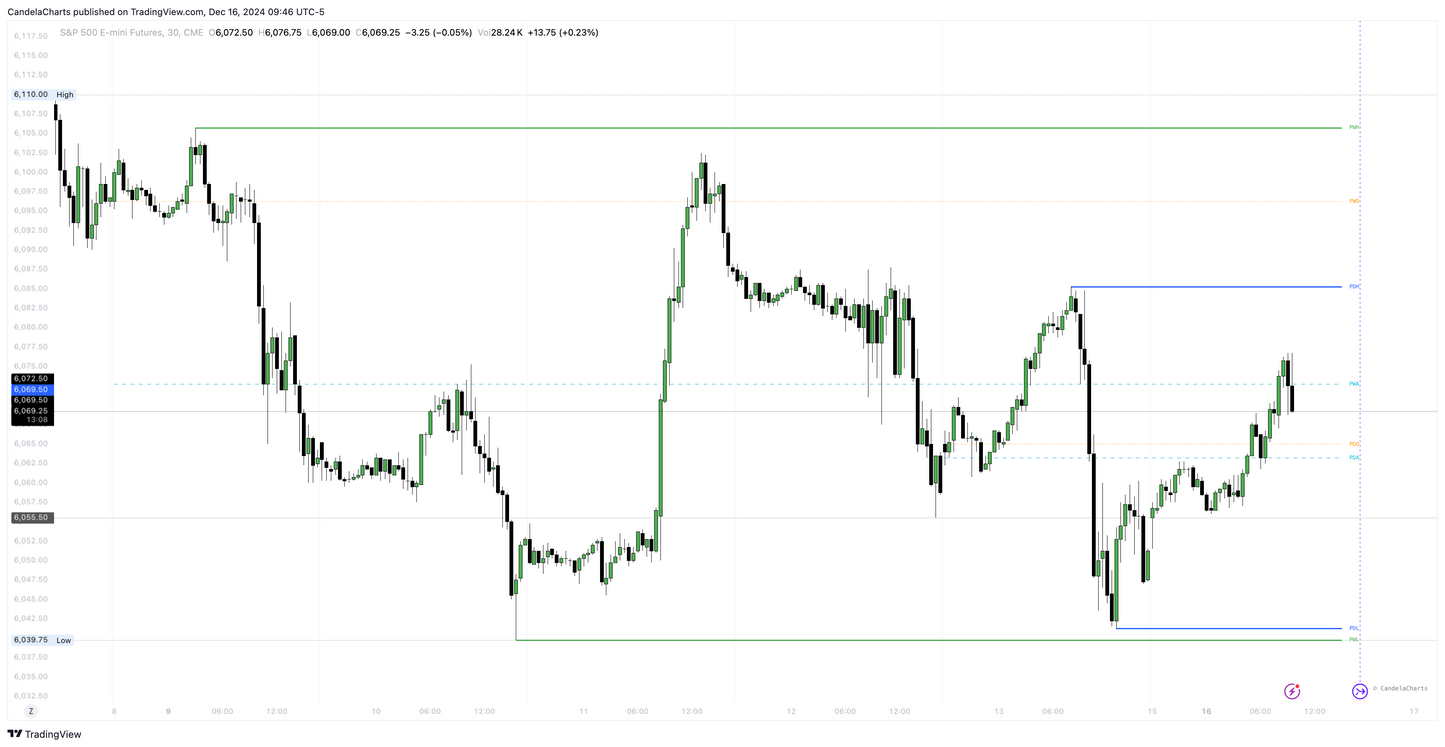
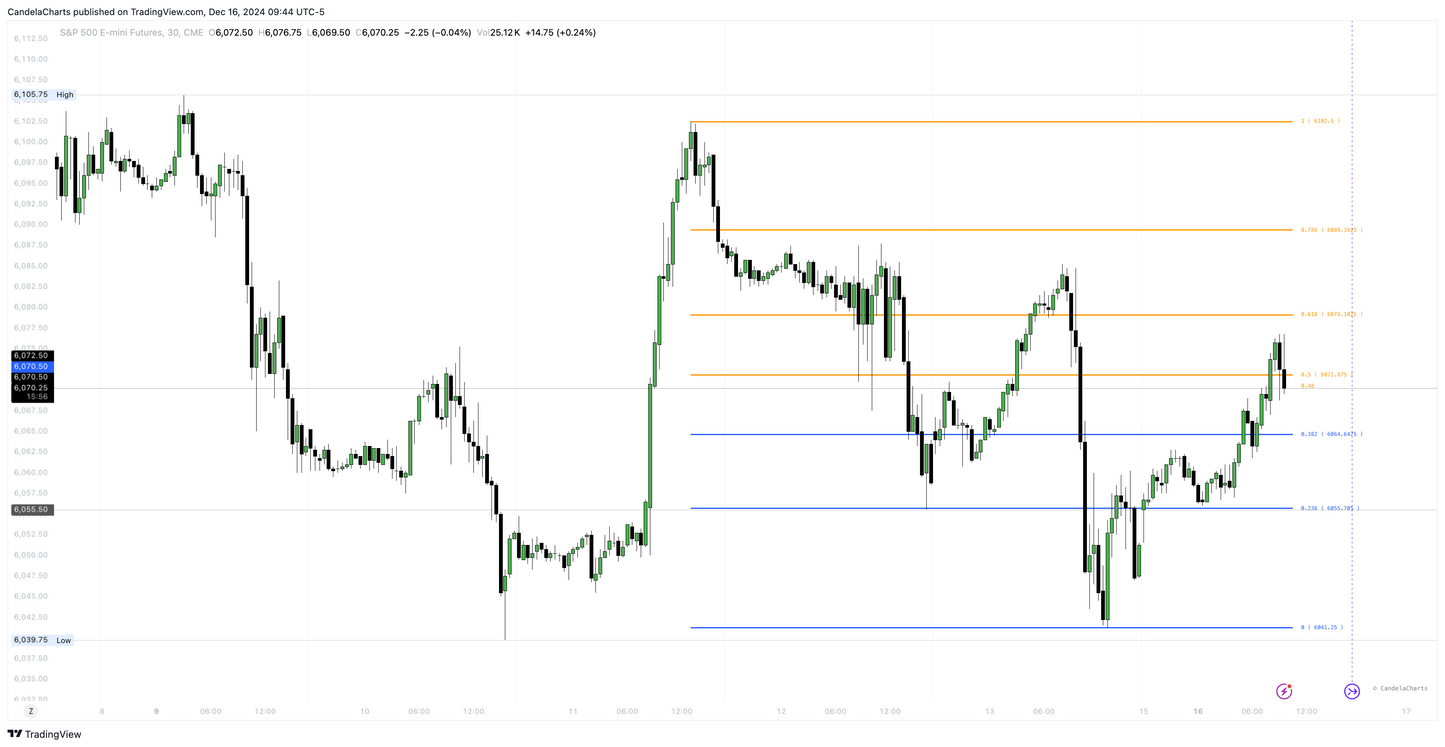
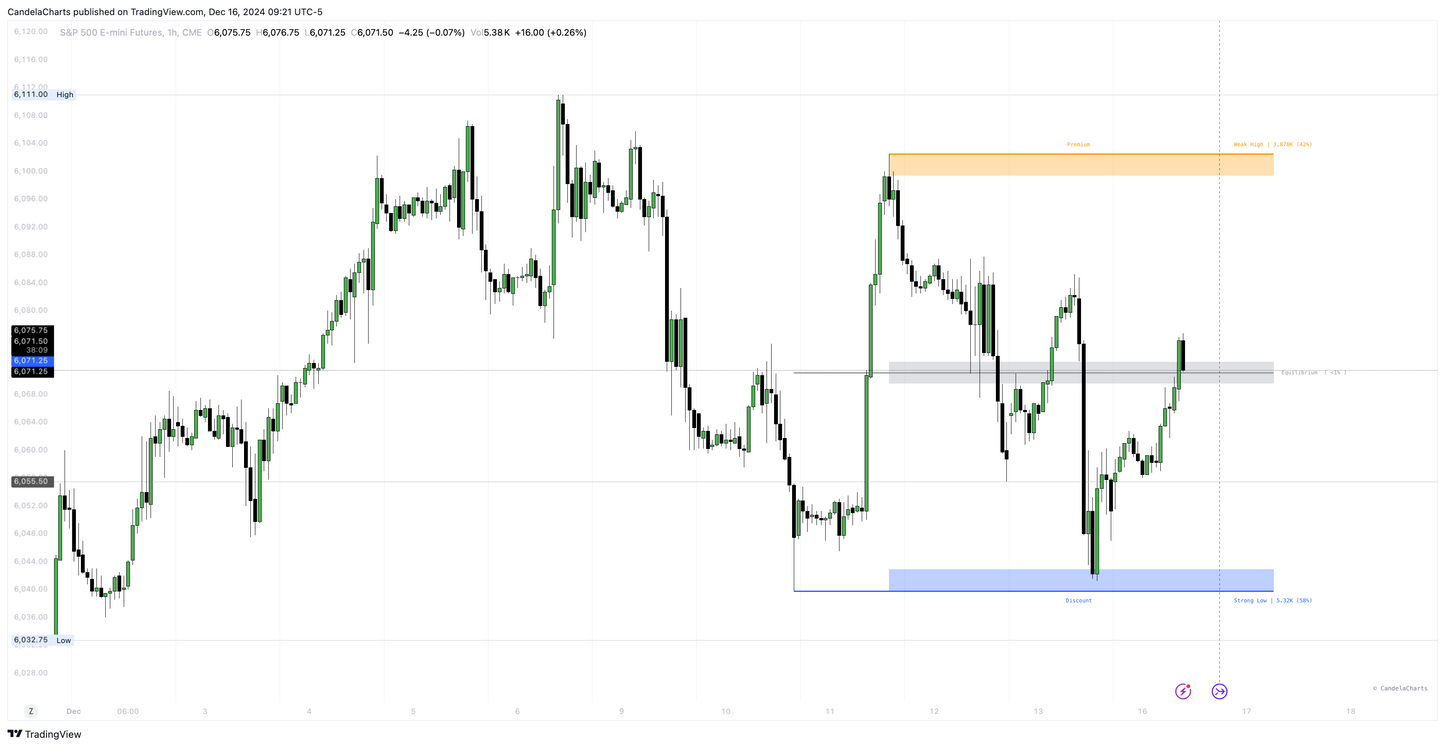
- Price Action Toolkit
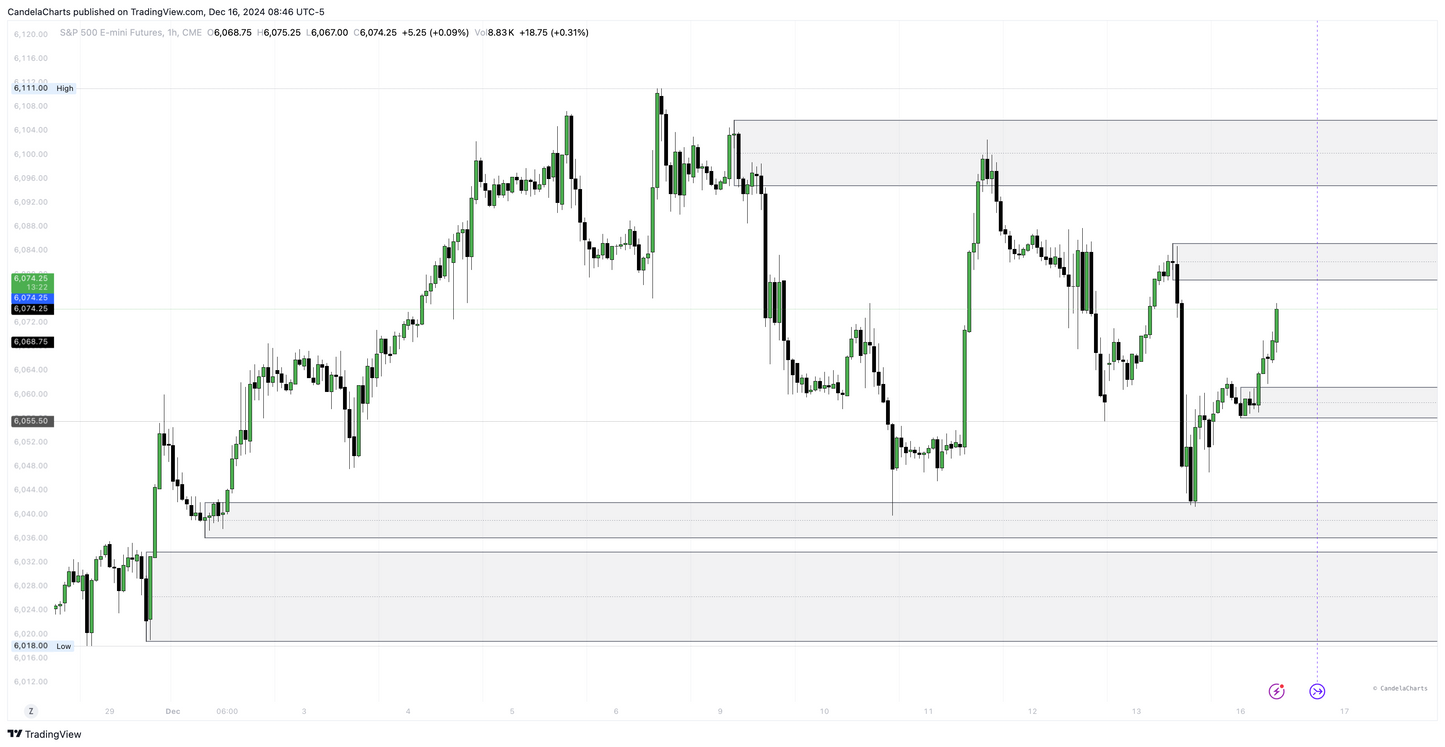
- Block Concepts
- Imbalance Concepts
- ICT Daily Profiles
- ICT Weekly Profiles
- Community access
- Indicator updates
- 24/7 support
The Price Action Toolkit pricing plan provides all the essential tools for traders who rely on raw price movement to guide their decisions.
This plan includes a suite of powerful features designed to analyze and interpret market action with precision, without relying on traditional indicators.
This plan is perfect for traders who prioritize clean, indicator-free charts and want to base their strategies on pure market dynamics. With the Price Action Toolkit, you’ll have all the tools needed to read the market with confidence and clarity.
Share


Blog
View all-
Understanding SFP In Trading
Candela Charts1. What is a Swing Failure Pattern (SFP)? A Swing Failure Pattern (SFP) occurs when the price temporarily breaks a key swing high or low but fails to continue in that direction,...
Understanding SFP In Trading
Candela Charts1. What is a Swing Failure Pattern (SFP)? A Swing Failure Pattern (SFP) occurs when the price temporarily breaks a key swing high or low but fails to continue in that direction,...
-

Trading Strategy: ICT Venom Model
Candela ChartsThe ICT Venom Model is an intraday trading strategy that leverages liquidity sweeps, Fair Value Gaps (FVGs), and Market Structure Shifts (MSS) to identify precise trade entries.
Trading Strategy: ICT Venom Model
Candela ChartsThe ICT Venom Model is an intraday trading strategy that leverages liquidity sweeps, Fair Value Gaps (FVGs), and Market Structure Shifts (MSS) to identify precise trade entries.
-

Understanding VWAP In Trading
Candela ChartsVWAP is a price benchmark that gives more importance to prices where higher trading volume occurs. Unlike simple moving averages, which treat each price point equally, VWAP provides a volume-weighted...
Understanding VWAP In Trading
Candela ChartsVWAP is a price benchmark that gives more importance to prices where higher trading volume occurs. Unlike simple moving averages, which treat each price point equally, VWAP provides a volume-weighted...
Subscribe to our emails
Be the first to know about new tools and exclusive offers.


