Candela
Model Plan
Model Plan
All future indicators designed for the Model Plan will be automatically added to your account according to your subscription option as soon as they are released.
- Fractal Range Model
- Turtle Soup Model
- Unicorn Model
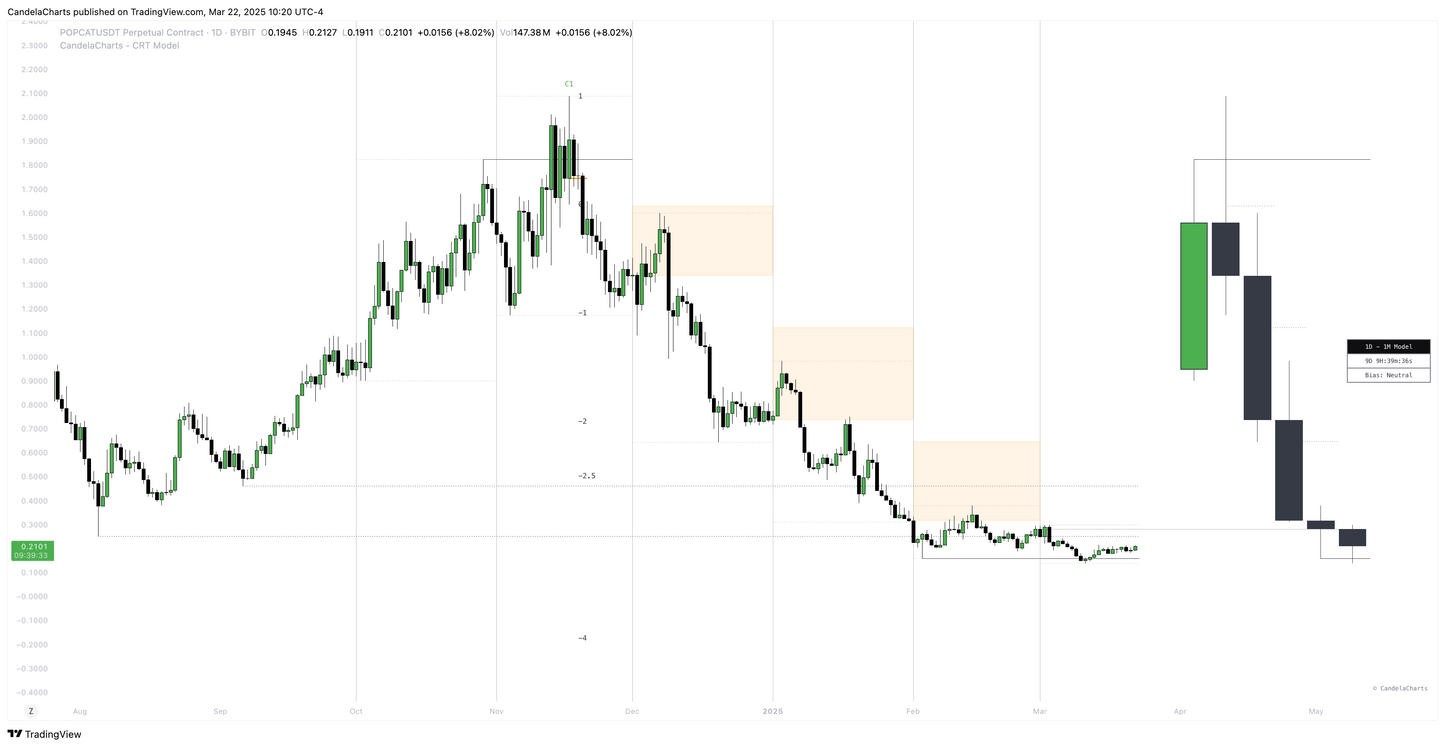
- CRT Model
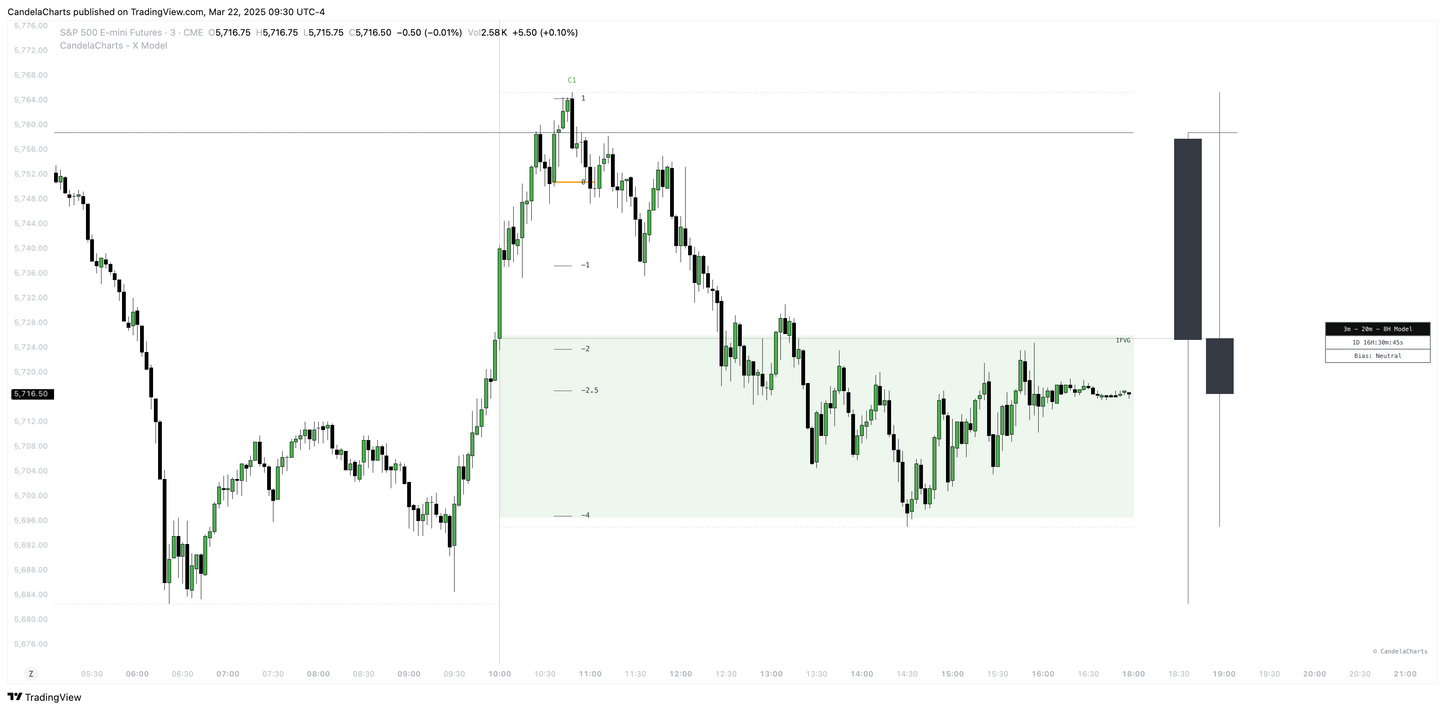
- X Model
- Indicator updates
- 24/7 support
Unlock powerful insights and take your trading strategy to the next level with our Model Plan. This comprehensive subscription grants you access to the following exclusive indicators, designed to help you make more informed decisions.
With the Model Plan, you get access to these cutting-edge models, empowering you to refine your trading strategy and gain a competitive edge in the market.
Whether you're a seasoned trader or just starting, this plan is your gateway to advanced trading insights.
Get started today and elevate your trading experience with the Model Plan!
Share


Blog
View all-

Understanding SFP In Trading
Candela Charts1. What is a Swing Failure Pattern (SFP)? A Swing Failure Pattern (SFP) occurs when the price temporarily breaks a key swing high or low but fails to continue in that direction,...
Understanding SFP In Trading
Candela Charts1. What is a Swing Failure Pattern (SFP)? A Swing Failure Pattern (SFP) occurs when the price temporarily breaks a key swing high or low but fails to continue in that direction,...
-

Trading Strategy: ICT Venom Model
Candela ChartsThe ICT Venom Model is an intraday trading strategy that leverages liquidity sweeps, Fair Value Gaps (FVGs), and Market Structure Shifts (MSS) to identify precise trade entries.
Trading Strategy: ICT Venom Model
Candela ChartsThe ICT Venom Model is an intraday trading strategy that leverages liquidity sweeps, Fair Value Gaps (FVGs), and Market Structure Shifts (MSS) to identify precise trade entries.
-

Understanding VWAP In Trading
Candela ChartsVWAP is a price benchmark that gives more importance to prices where higher trading volume occurs. Unlike simple moving averages, which treat each price point equally, VWAP provides a volume-weighted...
Understanding VWAP In Trading
Candela ChartsVWAP is a price benchmark that gives more importance to prices where higher trading volume occurs. Unlike simple moving averages, which treat each price point equally, VWAP provides a volume-weighted...
Subscribe to our emails
Be the first to know about new tools and exclusive offers.


