CandelaCharts
Imbalance Concepts
Imbalance Concepts
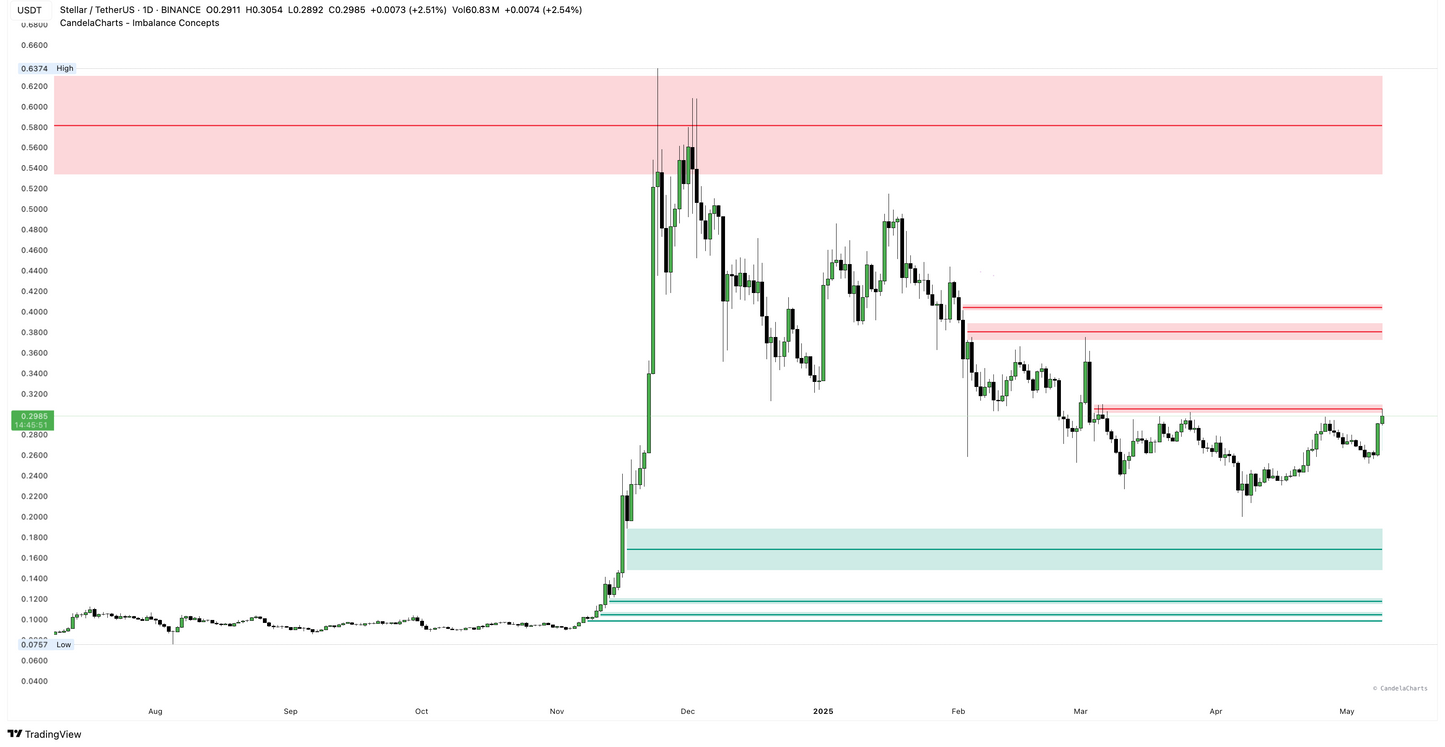
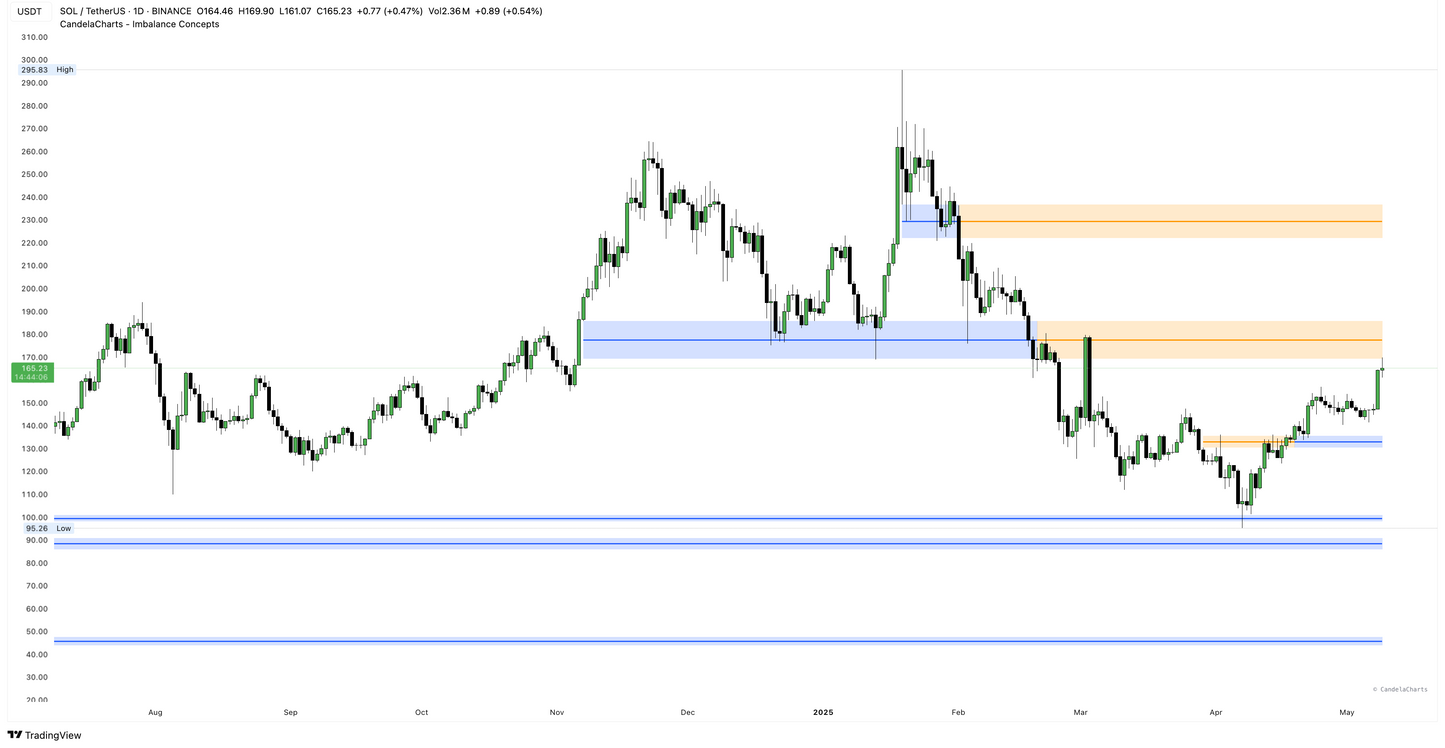
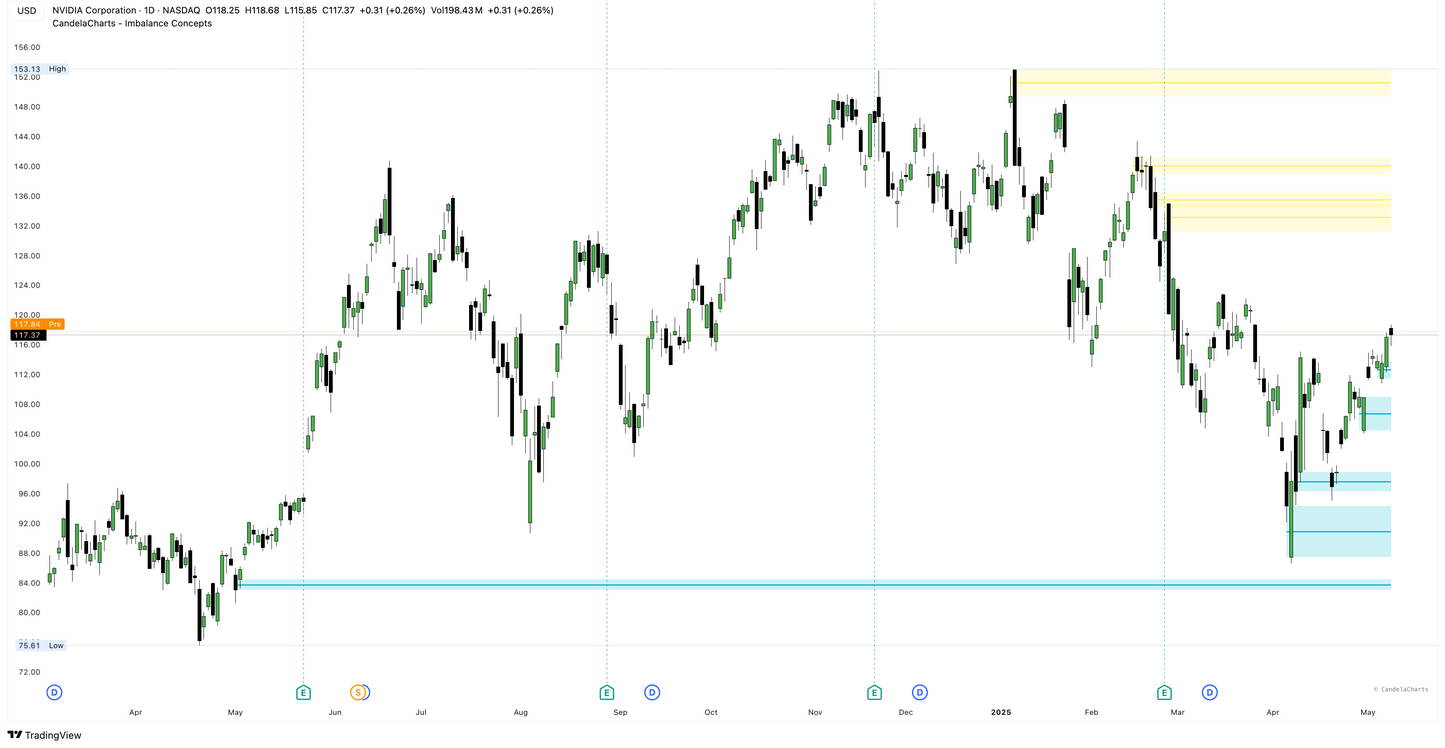
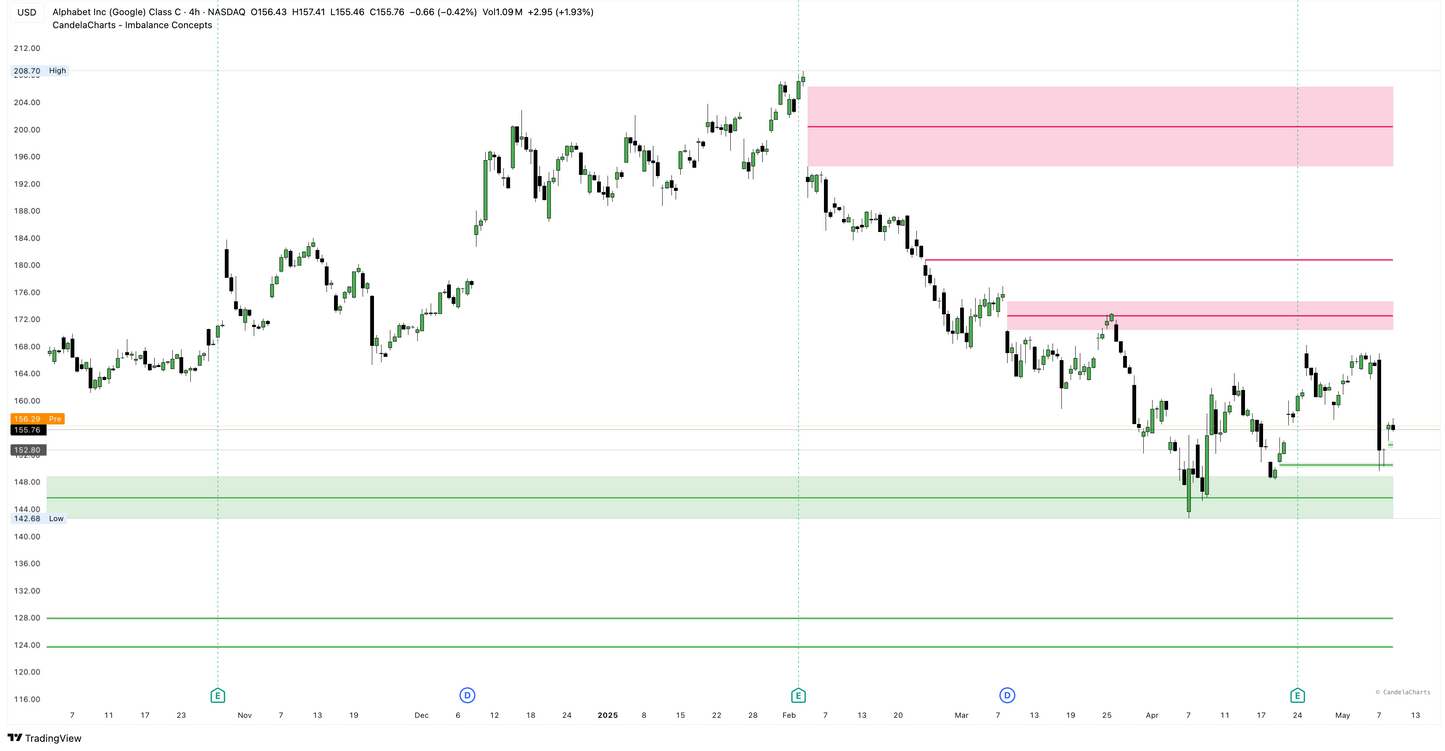
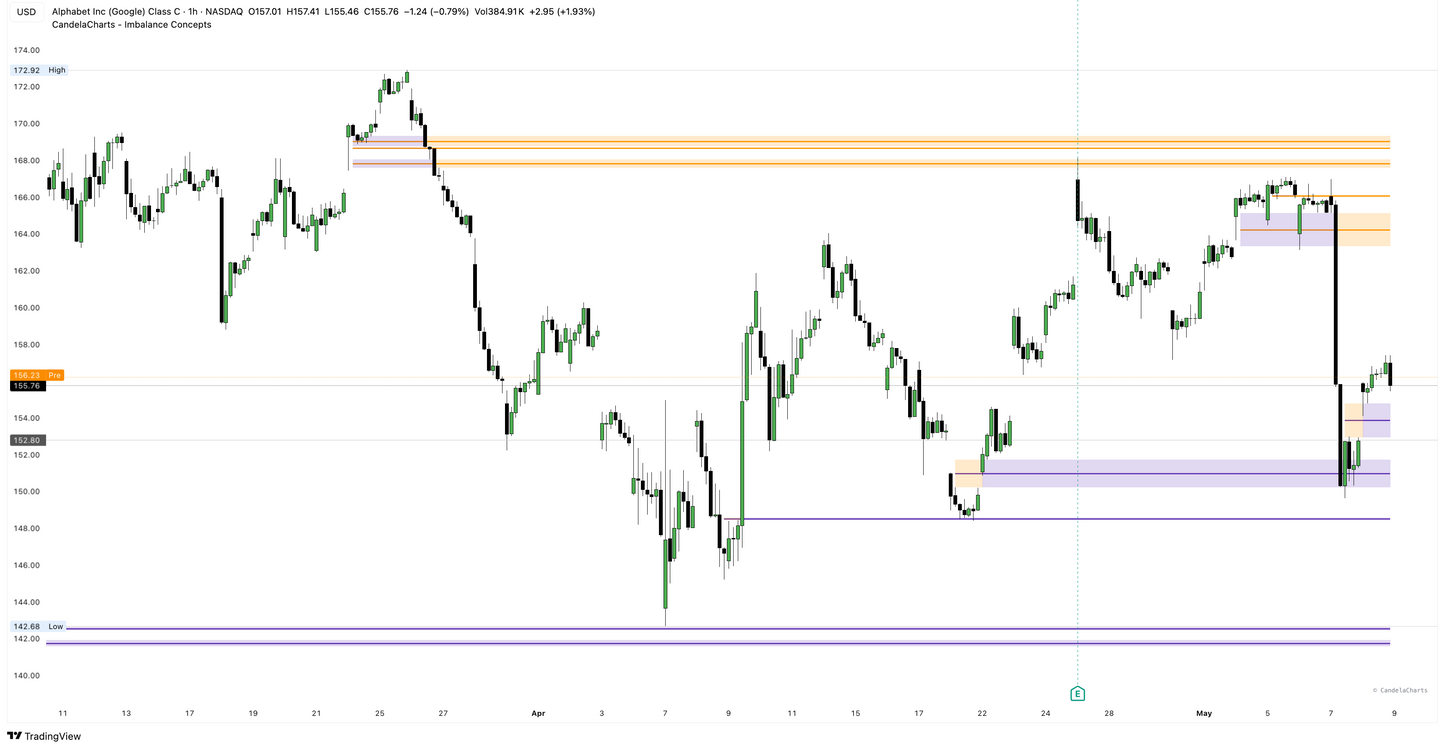
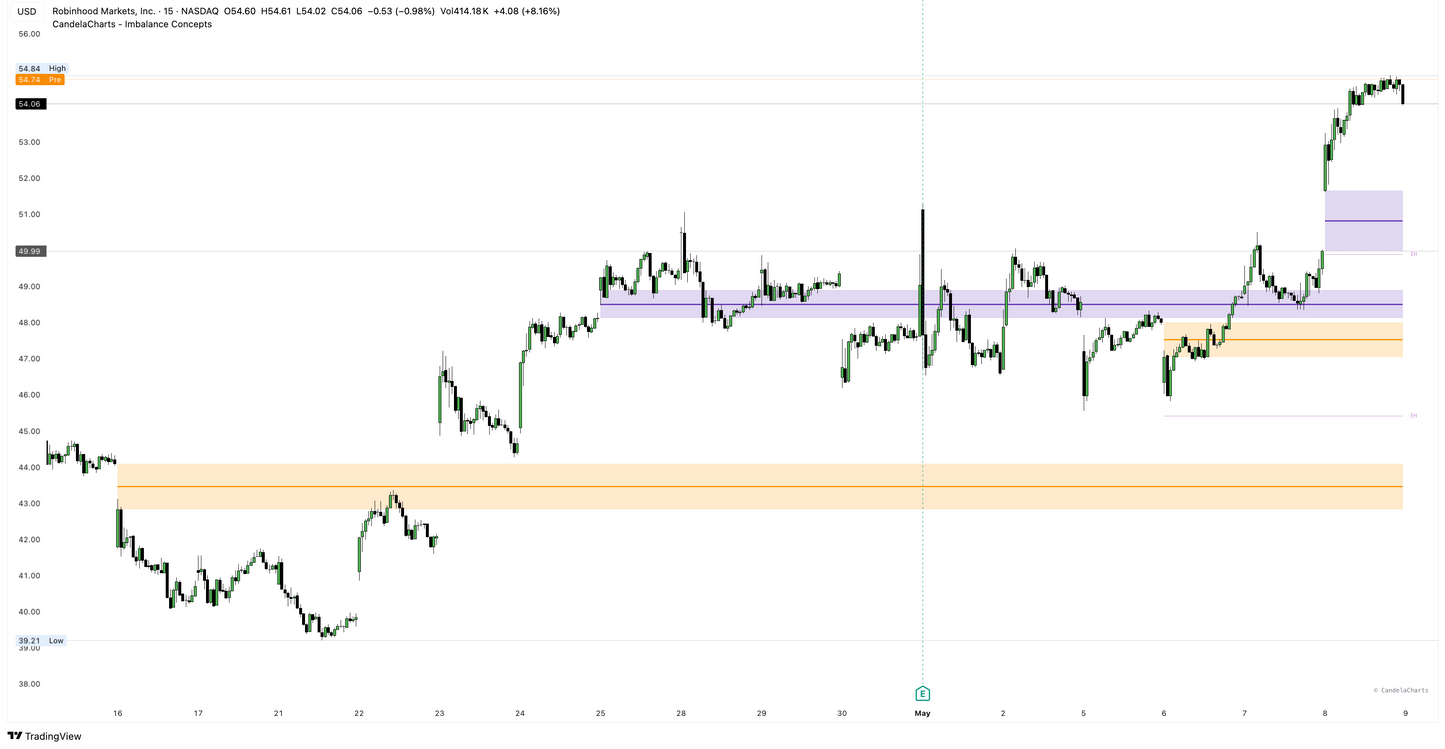
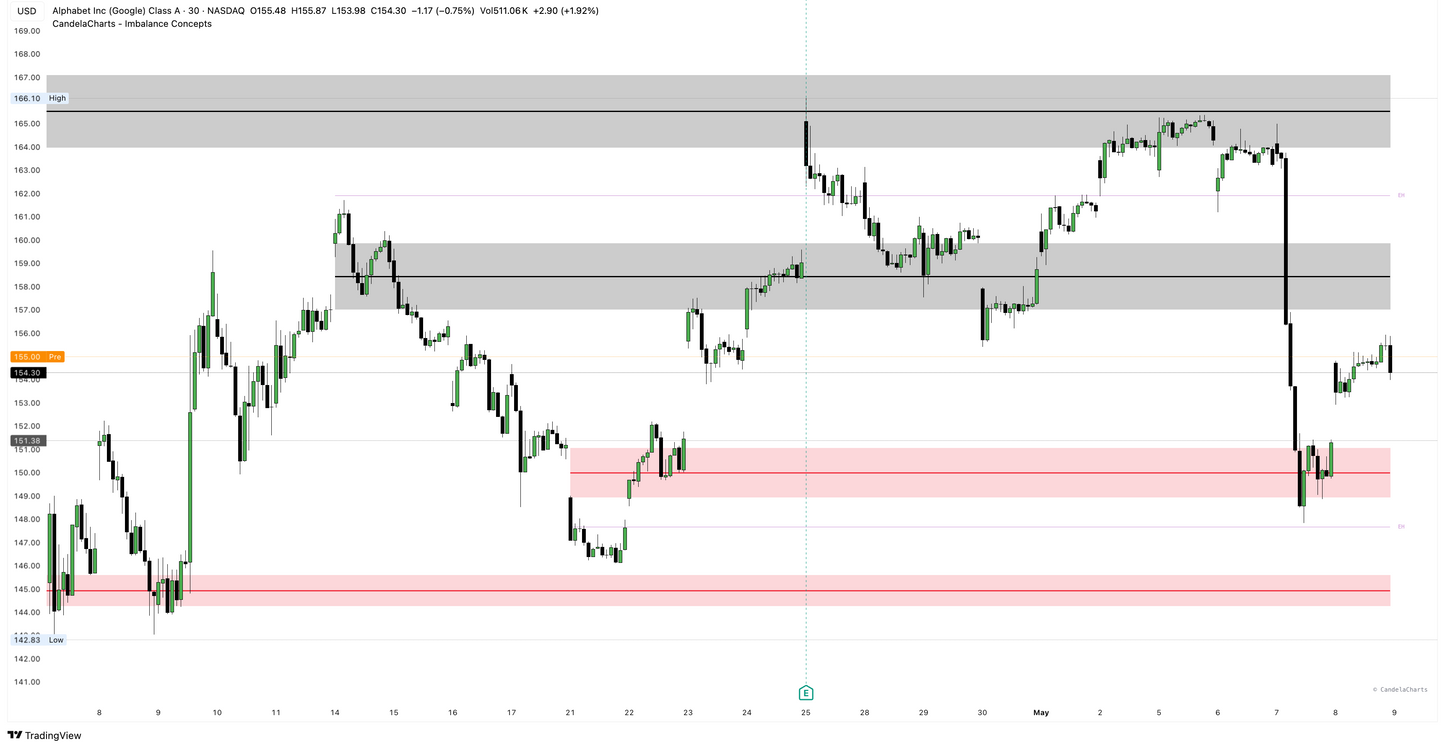
Imbalance Concepts is an advanced analysis toolkit specifically designed to highlight these key market areas. It’s built around the ICT framework, a trading methodology that focuses on understanding liquidity, smart money movement, and price structure.
Whether you're trading forex, crypto, or futures, this toolkit adapts to your charting environment and pinpoints potential zones of interest like support, resistance, and price inefficiencies.
Key Features and Benefits
- Pinpoints Support and Resistance: Automatically identifies price levels where market activity may pause or reverse.
- Enhances ICT Strategies: Complements the Inner Circle Trader approach with clear imbalance mapping.
- Multi-Market Compatibility: Works across major asset classes—forex, crypto, and futures.
- Improves Trade Precision: Helps traders avoid noise and focus on high-probability setups.
- Reduces Analysis Time: Provides visual clarity, speeding up decision-making without sacrificing depth.
In a world where markets are driven by algorithms and institutions, having the right tools to interpret price imbalances is critical. Imbalance Concepts empowers traders by transforming raw price action into actionable insight. Whether you’re new to ICT or a seasoned analyst, this toolkit can elevate your edge in today’s dynamic markets.
Share

Blog
View all-

Understanding SFP In Trading
Candela Charts1. What is a Swing Failure Pattern (SFP)? A Swing Failure Pattern (SFP) occurs when the price temporarily breaks a key swing high or low but fails to continue in that direction,...
Understanding SFP In Trading
Candela Charts1. What is a Swing Failure Pattern (SFP)? A Swing Failure Pattern (SFP) occurs when the price temporarily breaks a key swing high or low but fails to continue in that direction,...
-

Trading Strategy: ICT Venom Model
Candela ChartsThe ICT Venom Model is an intraday trading strategy that leverages liquidity sweeps, Fair Value Gaps (FVGs), and Market Structure Shifts (MSS) to identify precise trade entries.
Trading Strategy: ICT Venom Model
Candela ChartsThe ICT Venom Model is an intraday trading strategy that leverages liquidity sweeps, Fair Value Gaps (FVGs), and Market Structure Shifts (MSS) to identify precise trade entries.
-

Understanding VWAP In Trading
Candela ChartsVWAP is a price benchmark that gives more importance to prices where higher trading volume occurs. Unlike simple moving averages, which treat each price point equally, VWAP provides a volume-weighted...
Understanding VWAP In Trading
Candela ChartsVWAP is a price benchmark that gives more importance to prices where higher trading volume occurs. Unlike simple moving averages, which treat each price point equally, VWAP provides a volume-weighted...
Subscribe to our emails
Be the first to know about new tools and exclusive offers.


