


Blog
View all-
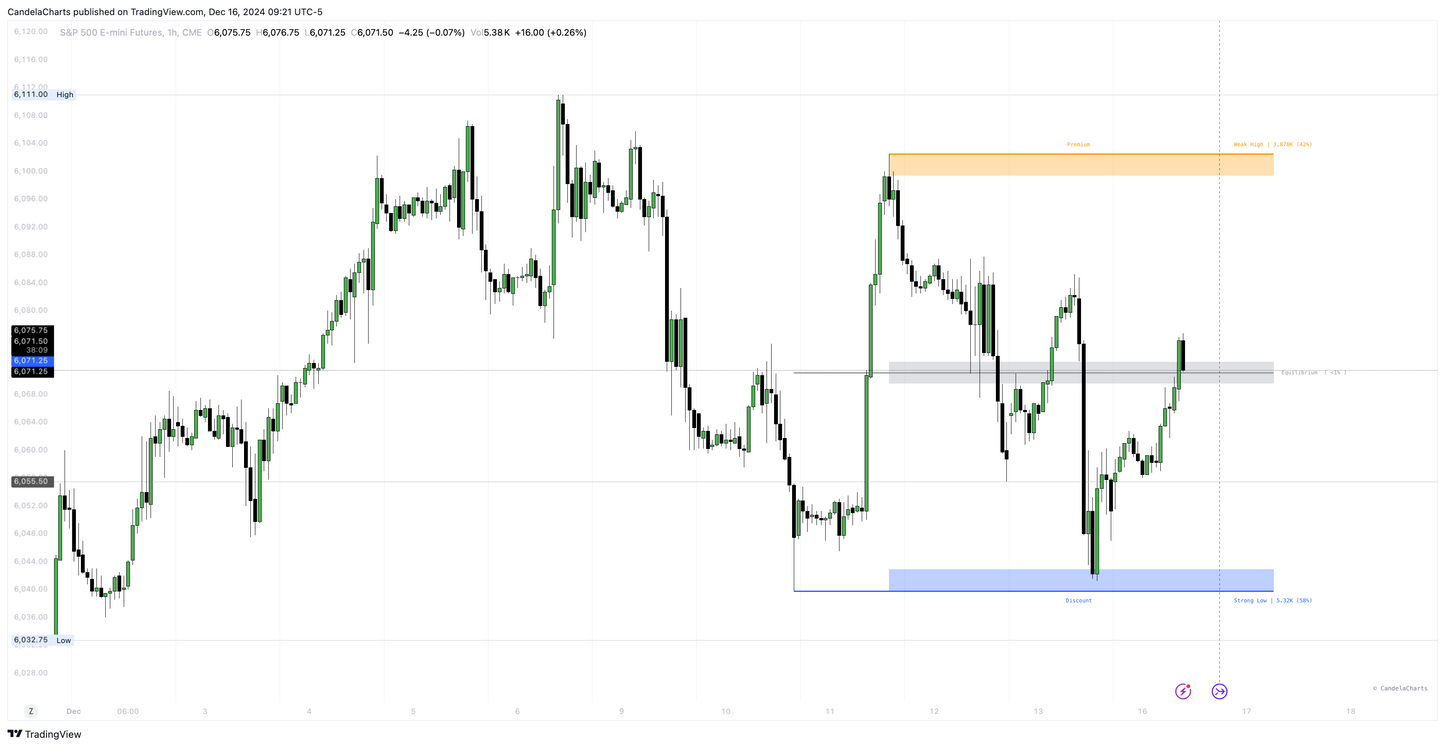
Understanding SFP In Trading
Candela Charts1. What is a Swing Failure Pattern (SFP)? A Swing Failure Pattern (SFP) occurs when the price temporarily breaks a key swing high or low but fails to continue in that direction,...
Understanding SFP In Trading
Candela Charts1. What is a Swing Failure Pattern (SFP)? A Swing Failure Pattern (SFP) occurs when the price temporarily breaks a key swing high or low but fails to continue in that direction,...
-

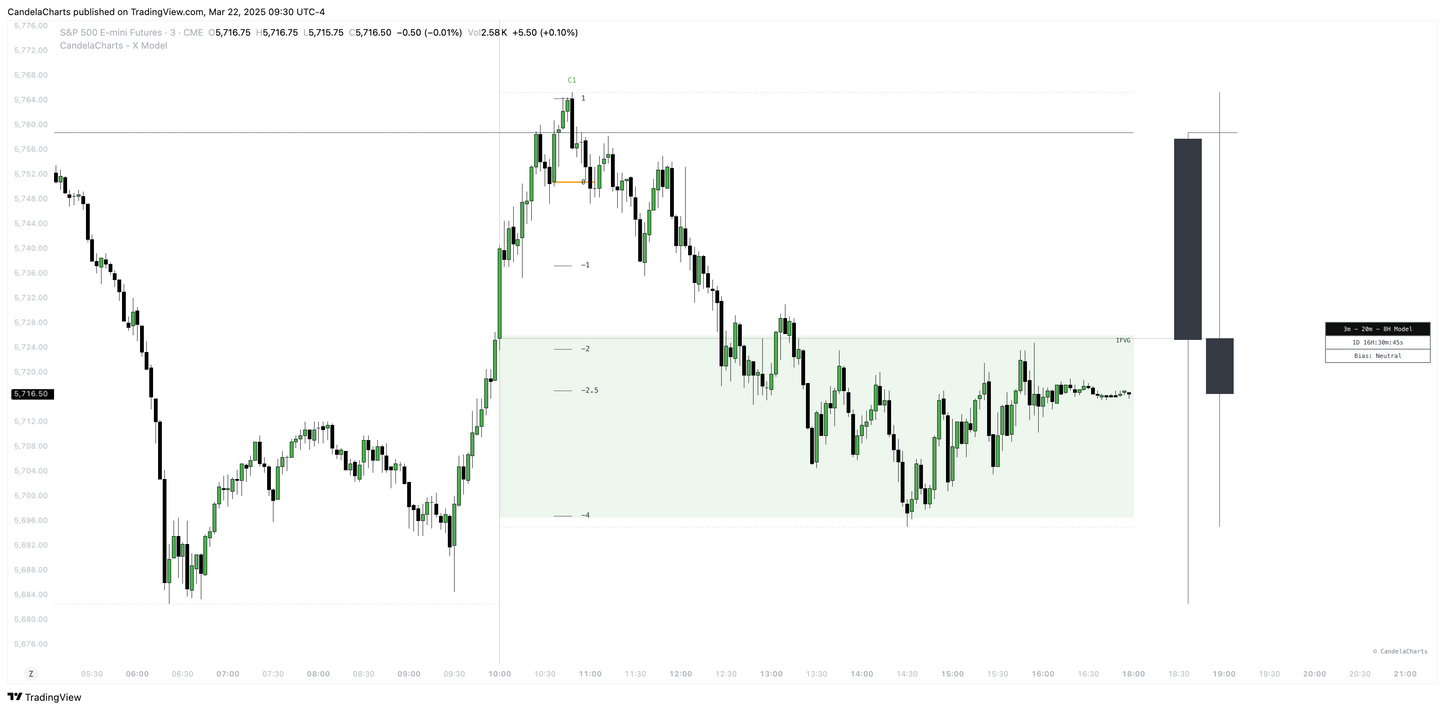
Trading Strategy: ICT Venom Model
Candela ChartsThe ICT Venom Model is an intraday trading strategy that leverages liquidity sweeps, Fair Value Gaps (FVGs), and Market Structure Shifts (MSS) to identify precise trade entries.
Trading Strategy: ICT Venom Model
Candela ChartsThe ICT Venom Model is an intraday trading strategy that leverages liquidity sweeps, Fair Value Gaps (FVGs), and Market Structure Shifts (MSS) to identify precise trade entries.
-

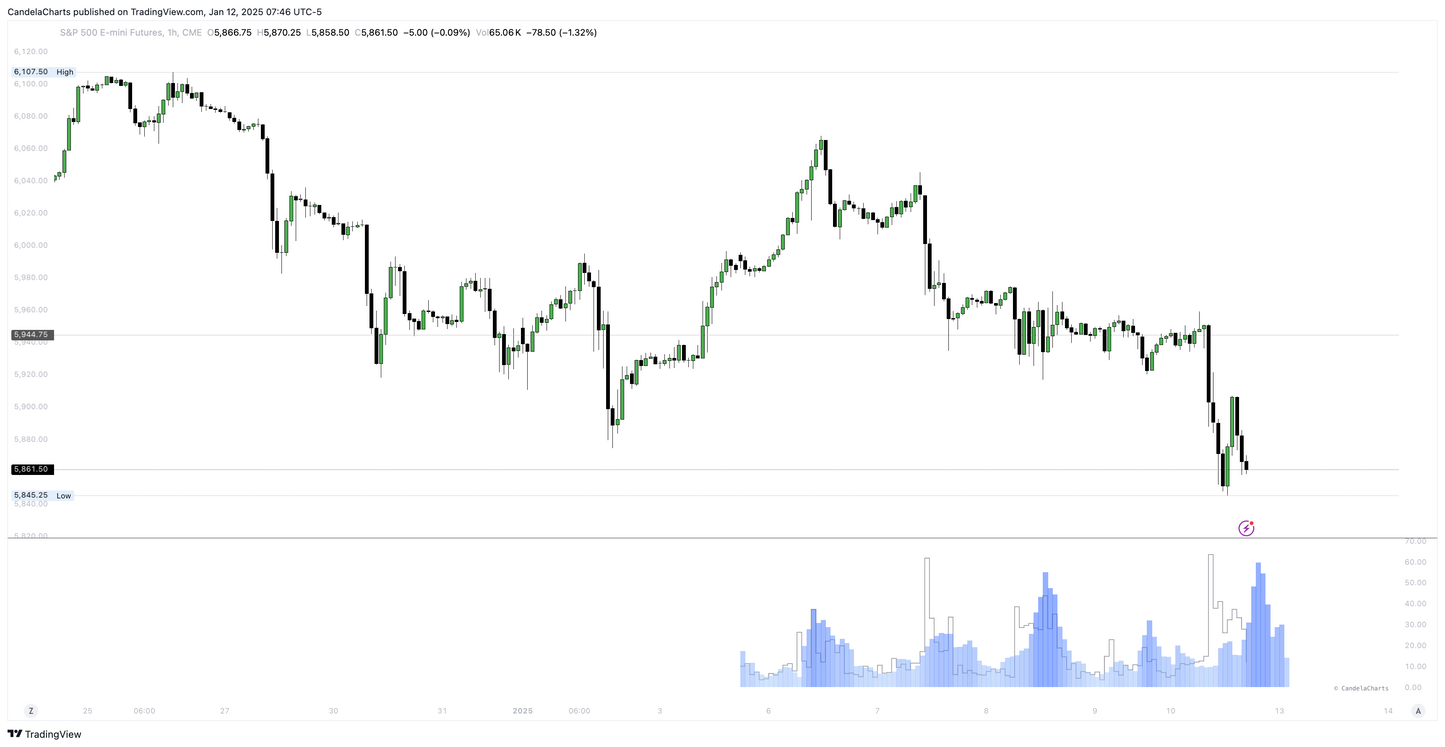
Understanding VWAP In Trading
Candela ChartsVWAP is a price benchmark that gives more importance to prices where higher trading volume occurs. Unlike simple moving averages, which treat each price point equally, VWAP provides a volume-weighted...
Understanding VWAP In Trading
Candela ChartsVWAP is a price benchmark that gives more importance to prices where higher trading volume occurs. Unlike simple moving averages, which treat each price point equally, VWAP provides a volume-weighted...


