Candela
Fractal Range Model
Fractal Range Model
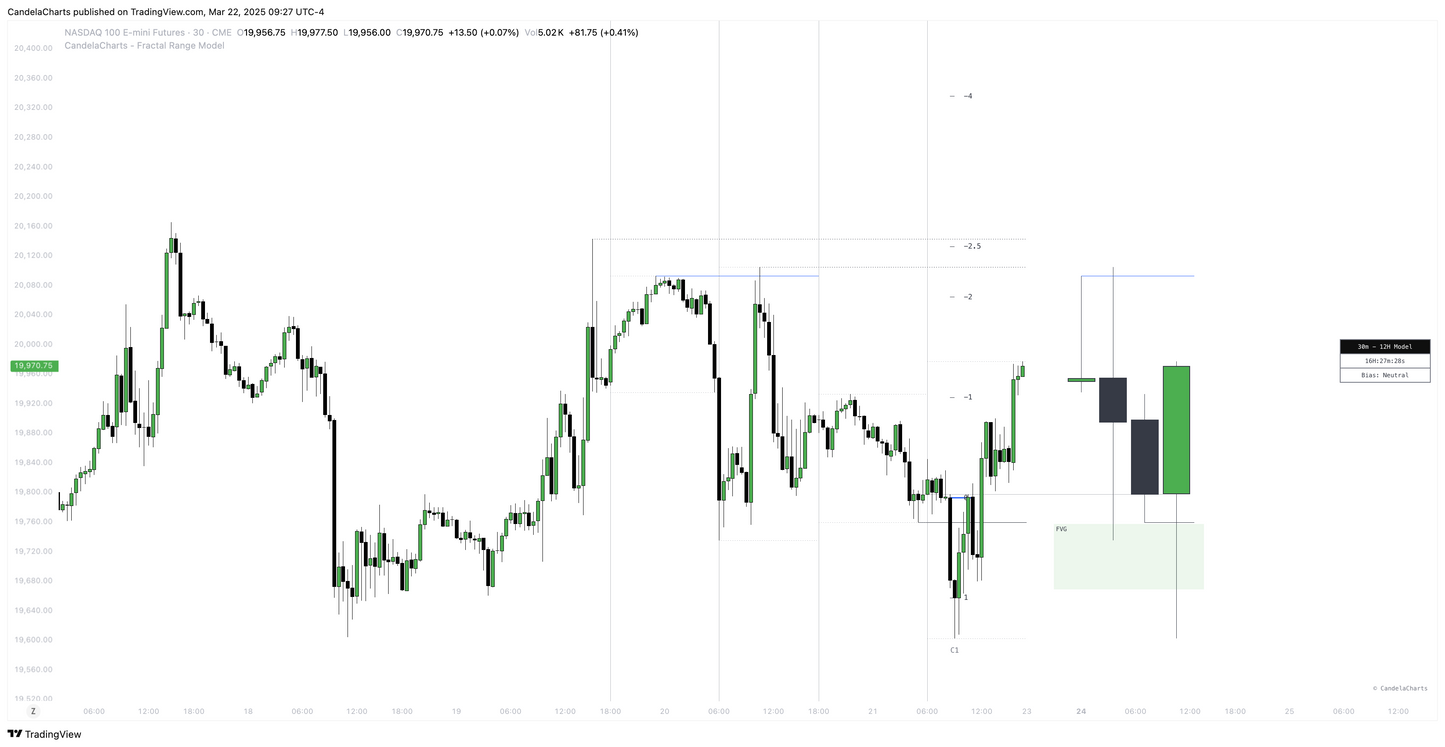
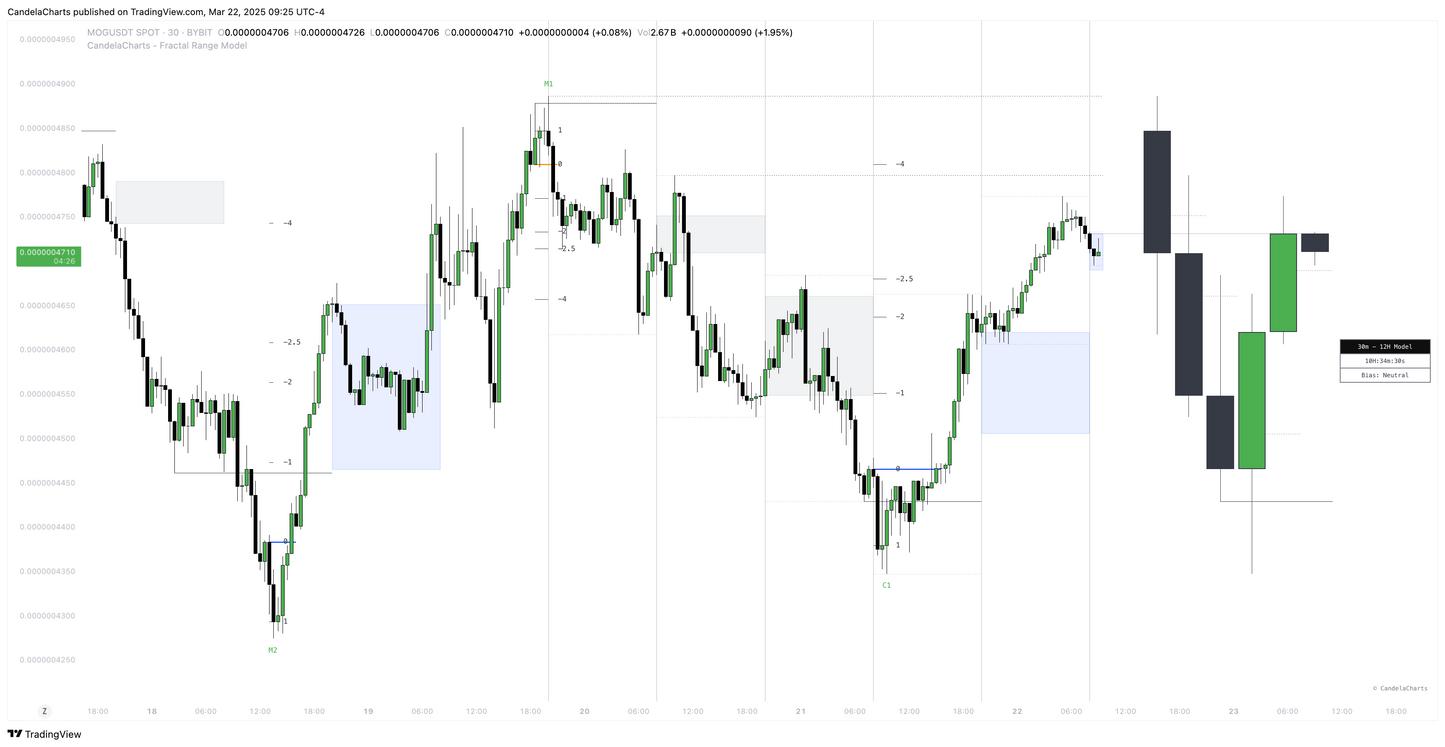
The Fractal Range Model (FRM) is a powerful TradingView indicator created by CandelaCharts, designed to help traders decode market structure, spot price imbalances, and identify high-probability trade setups across all timeframes.
Ideal for scalping, day trading, swing trading, and long-term investing, this model delivers precision and clarity in volatile market conditions.
Key Features:
- Timeframe Alignment: Visualize lower timeframe structures within higher timeframe candles to catch early trend shifts and micro market patterns.
- Bias Control: Customize your view with bullish, bearish, or neutral setups based on higher timeframe market bias.
- Double Purge Sweeps: Identify smart money manipulation zones where price takes out both previous highs and lows before reversing.
- Time Filters: Focus your analysis with customized time windows for optimal entry and exit timing.
- Higher Timeframe Candles: Built-in ICT Power of Three logic helps you spot accumulation, manipulation, and expansion phases.
- PD Arrays (Premium/Discount Levels): Detect key zones where smart money is likely to enter the market for powerful confluence.
- Smart Money Technique (SMT): Validate trade setups with SMT divergence, increasing confidence in your entries.
- Info Panel: Real-time data display showing bias, candle timing, timeframe pairing, and more.
Whether you're trading forex, crypto, stocks, or futures, the Fractal Range Model gives you an edge with a rules-based, visually intuitive approach grounded in smart money concepts and fractal geometry.
Share


Blog
View all-

Understanding SFP In Trading
Candela Charts1. What is a Swing Failure Pattern (SFP)? A Swing Failure Pattern (SFP) occurs when the price temporarily breaks a key swing high or low but fails to continue in that direction,...
Understanding SFP In Trading
Candela Charts1. What is a Swing Failure Pattern (SFP)? A Swing Failure Pattern (SFP) occurs when the price temporarily breaks a key swing high or low but fails to continue in that direction,...
-

Trading Strategy: ICT Venom Model
Candela ChartsThe ICT Venom Model is an intraday trading strategy that leverages liquidity sweeps, Fair Value Gaps (FVGs), and Market Structure Shifts (MSS) to identify precise trade entries.
Trading Strategy: ICT Venom Model
Candela ChartsThe ICT Venom Model is an intraday trading strategy that leverages liquidity sweeps, Fair Value Gaps (FVGs), and Market Structure Shifts (MSS) to identify precise trade entries.
-

Understanding VWAP In Trading
Candela ChartsVWAP is a price benchmark that gives more importance to prices where higher trading volume occurs. Unlike simple moving averages, which treat each price point equally, VWAP provides a volume-weighted...
Understanding VWAP In Trading
Candela ChartsVWAP is a price benchmark that gives more importance to prices where higher trading volume occurs. Unlike simple moving averages, which treat each price point equally, VWAP provides a volume-weighted...
Subscribe to our emails
Be the first to know about new tools and exclusive offers.


