Candela
CRT Model
CRT Model
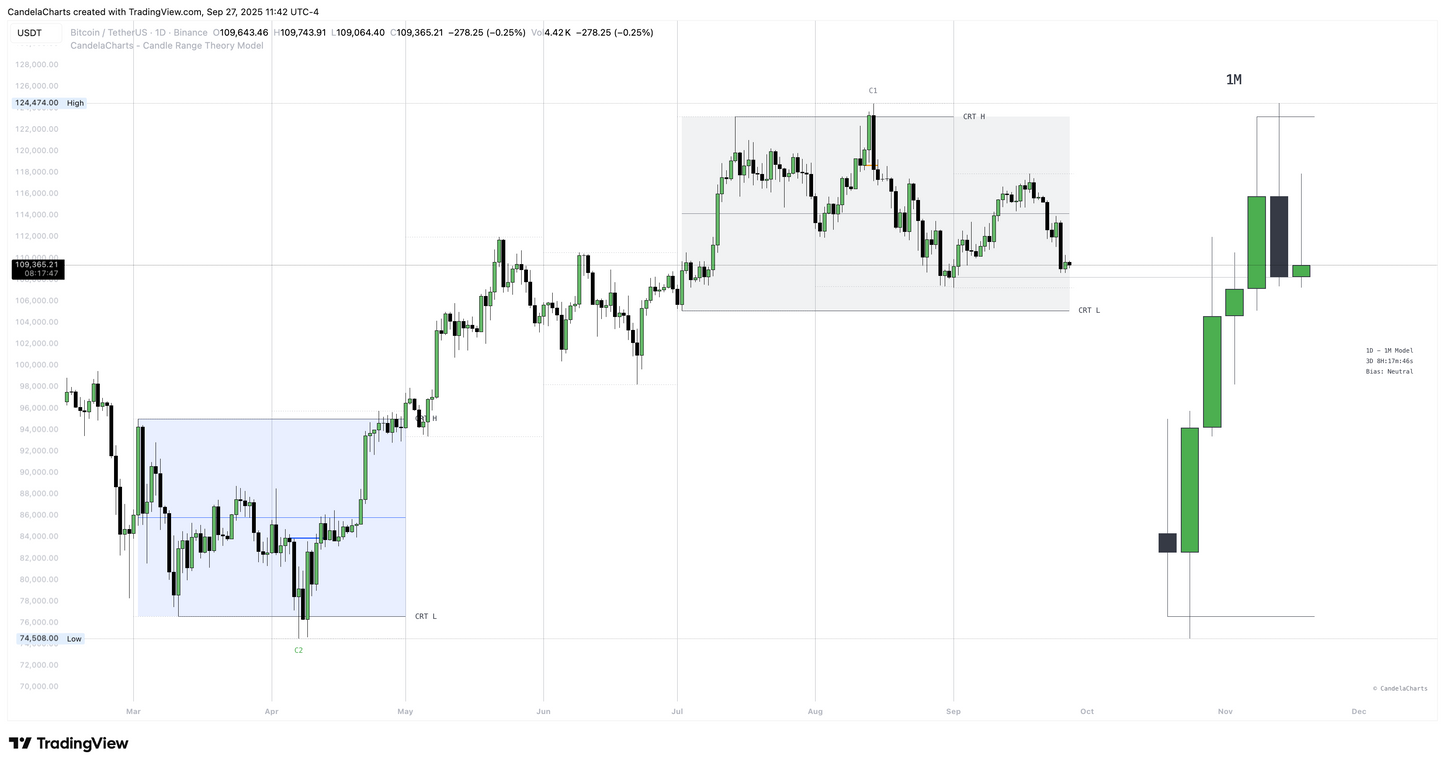
The CandelaCharts CRT Model is an advanced price action indicator on TradingView built around Candle Range Theory (CRT). Designed to help traders understand the full story within each candle, this model breaks down market behavior using time-based patterns and structure.
Perfect for scalping, day trading, swing trading, and long-term investing, the CRT Model gives traders a clear edge in reading market transitions and timing entries with confidence.
Key Features:
- Timeframe Pairing Visualization: See how lower timeframe price action plays out within each higher timeframe candle—ideal for catching early market structure shifts.
- Bias Detection & Setup Filtering: Highlight bullish, bearish, or neutral formations in sync with your preferred timeframe to align with macro and micro market trends.
- Double Purge Sweeps: Identify smart money manipulation zones where price wicks both sides of a previous candle before reversing.
- CRT Time Zones: Pinpoint specific times when high-probability setups are most likely to form—refining your trade entries.
- Power of Three Integration (ICT): Incorporates ICT’s methodology to help traders identify accumulation, manipulation, and expansion phases across timeframes.
- Custom Dashboard Panel: Displays live data on candle bias, timeframe pairings, time-to-close, and other vital stats to support fast decision-making.
- All Market Compatibility: Works across all asset classes—crypto, forex, stocks, futures, and commodities—delivering consistent analysis in any market.
Whether you're a beginner looking for structure or an experienced trader searching for refined timing, the CRT Model is your all-in-one toolkit for decoding candle behavior and capitalizing on market inefficiencies.
Share


Blog
View all-

Understanding SFP In Trading
Candela Charts1. What is a Swing Failure Pattern (SFP)? A Swing Failure Pattern (SFP) occurs when the price temporarily breaks a key swing high or low but fails to continue in that direction,...
Understanding SFP In Trading
Candela Charts1. What is a Swing Failure Pattern (SFP)? A Swing Failure Pattern (SFP) occurs when the price temporarily breaks a key swing high or low but fails to continue in that direction,...
-

Trading Strategy: ICT Venom Model
Candela ChartsThe ICT Venom Model is an intraday trading strategy that leverages liquidity sweeps, Fair Value Gaps (FVGs), and Market Structure Shifts (MSS) to identify precise trade entries.
Trading Strategy: ICT Venom Model
Candela ChartsThe ICT Venom Model is an intraday trading strategy that leverages liquidity sweeps, Fair Value Gaps (FVGs), and Market Structure Shifts (MSS) to identify precise trade entries.
-

Understanding VWAP In Trading
Candela ChartsVWAP is a price benchmark that gives more importance to prices where higher trading volume occurs. Unlike simple moving averages, which treat each price point equally, VWAP provides a volume-weighted...
Understanding VWAP In Trading
Candela ChartsVWAP is a price benchmark that gives more importance to prices where higher trading volume occurs. Unlike simple moving averages, which treat each price point equally, VWAP provides a volume-weighted...
Subscribe to our emails
Be the first to know about new tools and exclusive offers.


